Monitor hardware health in SAM
You can get immediate insight into hardware issues in your SAM environment by tracking key parameters for servers such as fan status, power supply status, and temperature. Monitoring hardware health on supported devices lets you know their status so you can:
-
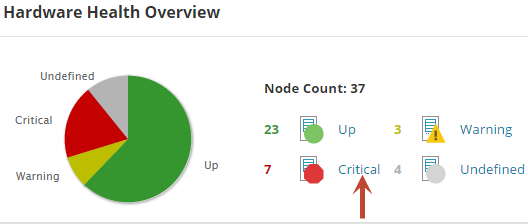
Pinpoint performance issues caused by hardware failure. SAM provides instant visibility of the device status (Up, Down, Critical, Warning, or Unknown) and allows you to set baseline values that trigger alerts if levels fall below set thresholds.
-
Optimize resource utilization and hardware procurement. Gain deep visibility into usage of server resources to make informed decisions about hardware purchases.
-
Use one interface to manage a heterogeneous IT infrastructure. From a single console, monitor multi-vendor infrastructure, including Cisco UCS, Dell, HP, IBM, Nutanix, and VMware hosts.
Get started monitoring hardware health for Dell, HP, HPE ProLiant, and IBM servers
- Review hardware health monitoring requirements, including supported devices.
- Download, install, and configure hardware monitoring agent software from third-party vendors. Click here for details.
- Run Discovery to detect third-party agent software and enable hardware health monitoring automatically across multiple nodes.
You can also enable hardware health monitoring for individual nodes.
When SAM enables hardware health monitoring during Discovery, it also enables Asset Inventory data collection to track each node's hardware and software. Polling jobs begin immediately, and are later scheduled to occur at random times over a 24-hour period. If necessary, you can adjust the default interval for Asset Inventory polling.
Note: While the SolarWinds Platform still supports Dell OpenManage Server Administrator (OMSA), Dell is no longer actively developing OMSA.
Monitor hardware health for UCS devices
Start by adding the parent UCS controller to the SolarWinds Platform. See Monitor Cisco UCS Devices for details.
Monitor hardware health in Nutanix environments
Add Hyper-V or VMware nodes for monitoring, add the parent Nutanix cluster, and provide Controller VM (CVM) credentials. See Monitor hardware health for Nutanix clusters.
Documentation about SolarWinds Platform features available in multiple modules is stored in the SolarWinds Platform Administrator Guide. Because hardware health monitoring for UCS and Nutanix is a shared feature, you'll find related information in that document.
Display hardware health in the SolarWinds Platform Web Console
- Click My Dashboards > Home, and then locate the Hardware Health Overview widget.
- To view a status, click its label.
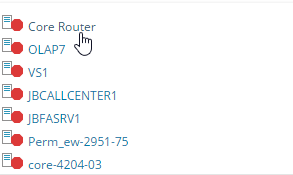
- Click the node you want to review.
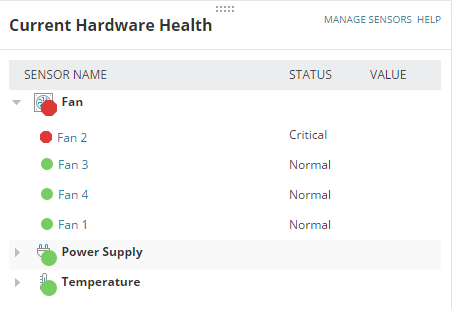
- Review the Current Hardware Health widget. Sensors listed as Critical should be investigated.
To learn more about hardware health monitoring, see the SAM Administrator Guide and the SolarWinds Platform Administrator Guide.